Heim >Backend-Entwicklung >Python-Tutorial >MovingMNIST in PyTorch
MovingMNIST in PyTorch
- Linda HamiltonOriginal
- 2024-12-17 04:35:25287Durchsuche
Kauf mir einen Kaffee☕
*Mein Beitrag erklärt das Verschieben von MNIST.
MovingMNIST() kann den Moving MNIST-Datensatz wie unten gezeigt verwenden:
*Memos:
- Das 1. Argument ist root(Required-Type:str oder pathlib.Path). *Ein absoluter oder relativer Pfad ist möglich.
- Das 2. Argument ist geteilt (Optional-Default:None-Type:str):
*Memos:
- Keine, es kann „Trainieren“ oder „Testen“ eingestellt werden.
- Wenn es „None“ ist, werden alle 20 Frames (Bilder) jedes Videos zurückgegeben, wobei „split_ratio“ ignoriert wird.
- Das dritte Argument ist split_ratio(Optional-Default:10-Type:int):
*Memos:
- Wenn split „train“ ist, werden data[:, :split_ratio] zurückgegeben.
- Wenn split „test“ ist, werden data[:, split_ratio:] zurückgegeben.
- Wenn die Aufteilung „Keine“ ist, wird sie ignoriert. ignoriere split_ratio.
- Das 4. Argument ist transform(Optional-Default:None-Type:callable).
- Das 5. Argument ist download(Optional-Default:False-Type:bool):
*Memos:
- Wenn es „Wahr“ ist, wird der Datensatz aus dem Internet in das Root-Konto heruntergeladen.
- Wenn es „True“ ist und der Datensatz bereits heruntergeladen wurde, wird er extrahiert.
- Wenn es „True“ ist und der Datensatz bereits heruntergeladen wurde, passiert nichts.
- Es sollte False sein, wenn der Datensatz bereits heruntergeladen wurde, da es schneller ist.
- Sie können den Datensatz hier manuell herunterladen und extrahieren, um ihn z. data/MovingMNIST/.
from torchvision.datasets import MovingMNIST

all_data = MovingMNIST(
    root="data"
)

all_data = MovingMNIST(
    root="data",
    split=None,
    split_ratio=10,
    download=False,
    transform=None
)

train_data = MovingMNIST(
    root="data",
    split="train"
)

test_data = MovingMNIST(
    root="data",
    split="test"
)

len(all_data), len(train_data), len(test_data)
# (10000, 10000, 10000)

len(all_data[0]), len(train_data[0]), len(test_data[0])
# (20, 10, 10)

all_data
# Dataset MovingMNIST
#     Number of datapoints: 10000
#     Root location: data

all_data.root
# 'data'

print(all_data.split)
# None

all_data.split_ratio
# 10

all_data.download
# <bound method MovingMNIST.download of Dataset MovingMNIST
#     Number of datapoints: 10000
#     Root location: data>

print(all_data.transform)
# None

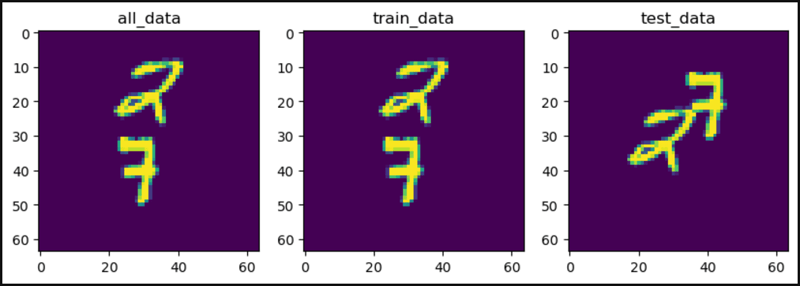
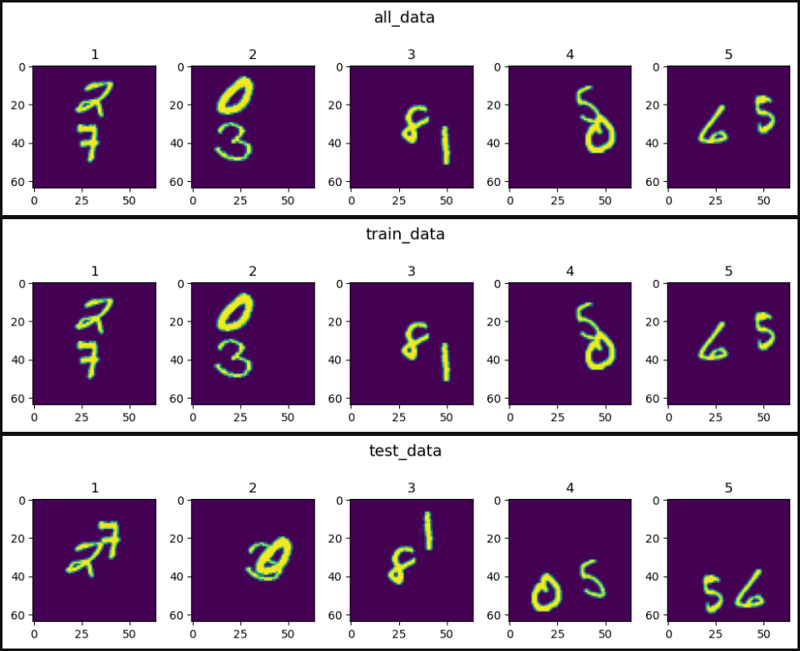
from torchvision.datasets import MovingMNIST

import matplotlib.pyplot as plt

plt.figure(figsize=(10, 3))

plt.subplot(1, 3, 1)
plt.title("all_data")
plt.imshow(all_data[0].squeeze()[0])

plt.subplot(1, 3, 2)
plt.title("train_data")
plt.imshow(train_data[0].squeeze()[0])

plt.subplot(1, 3, 3)
plt.title("test_data")
plt.imshow(test_data[0].squeeze()[0])

plt.show()
from torchvision.datasets import MovingMNIST

all_data = MovingMNIST(
    root="data",
    split=None
)

train_data = MovingMNIST(
    root="data",
    split="train"
)

test_data = MovingMNIST(
    root="data",
    split="test"
)

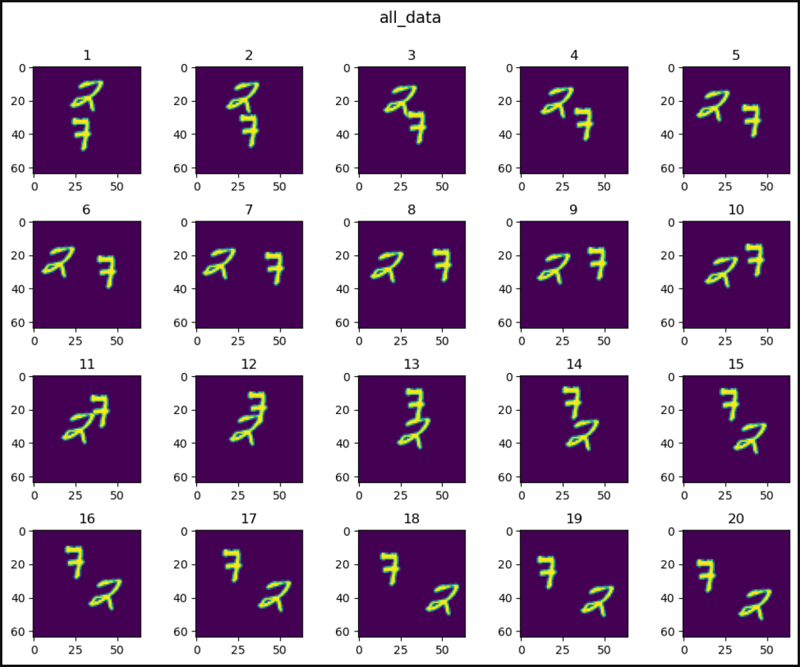
def show_images(data, main_title=None):
    plt.figure(figsize=(10, 8))
    plt.suptitle(t=main_title, y=1.0, fontsize=14)
    for i, image in enumerate(data, start=1):
        plt.subplot(4, 5, i)
        plt.tight_layout(pad=1.0)
        plt.title(i)
        plt.imshow(image)
    plt.show()

show_images(data=all_data[0].squeeze(), main_title="all_data")
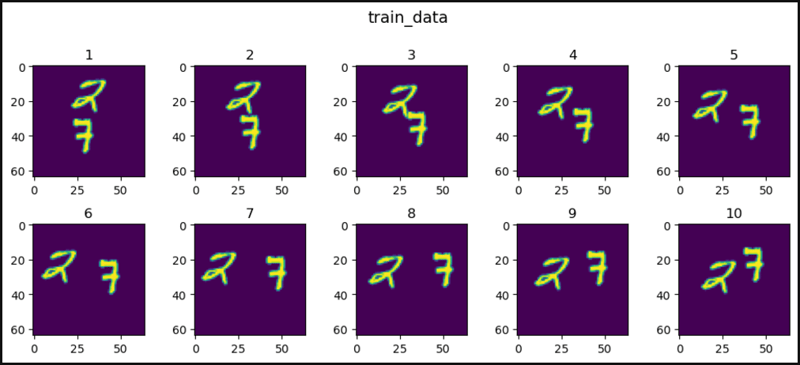
show_images(data=train_data[0].squeeze(), main_title="train_data")
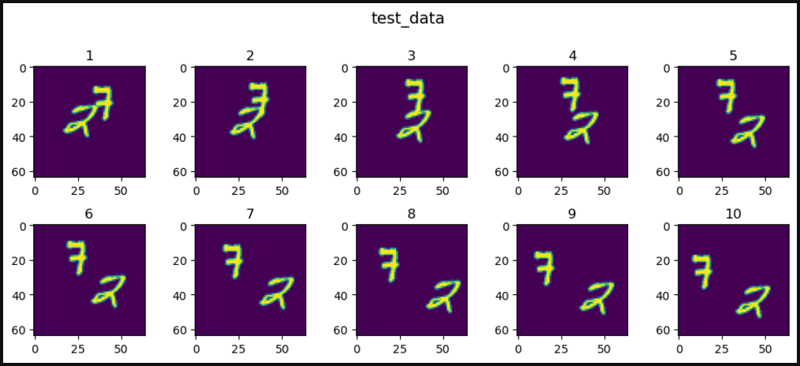
show_images(data=test_data[0].squeeze(), main_title="test_data")
from torchvision.datasets import MovingMNIST

all_data = MovingMNIST(
    root="data",
    split=None
)

train_data = MovingMNIST(
    root="data",
    split="train"
)

test_data = MovingMNIST(
    root="data",
    split="test"
)

import matplotlib.pyplot as plt

def show_images(data, main_title=None):
    plt.figure(figsize=(10, 8))
    plt.suptitle(t=main_title, y=1.0, fontsize=14)
    col = 5
    for i, image in enumerate(data, start=1):
        plt.subplot(4, 5, i)
        plt.tight_layout(pad=1.0)
        plt.title(i)
        plt.imshow(image.squeeze()[0])
        if i == col:
            break
    plt.show()

show_images(data=all_data, main_title="all_data")
show_images(data=train_data, main_title="train_data")
show_images(data=test_data, main_title="test_data")
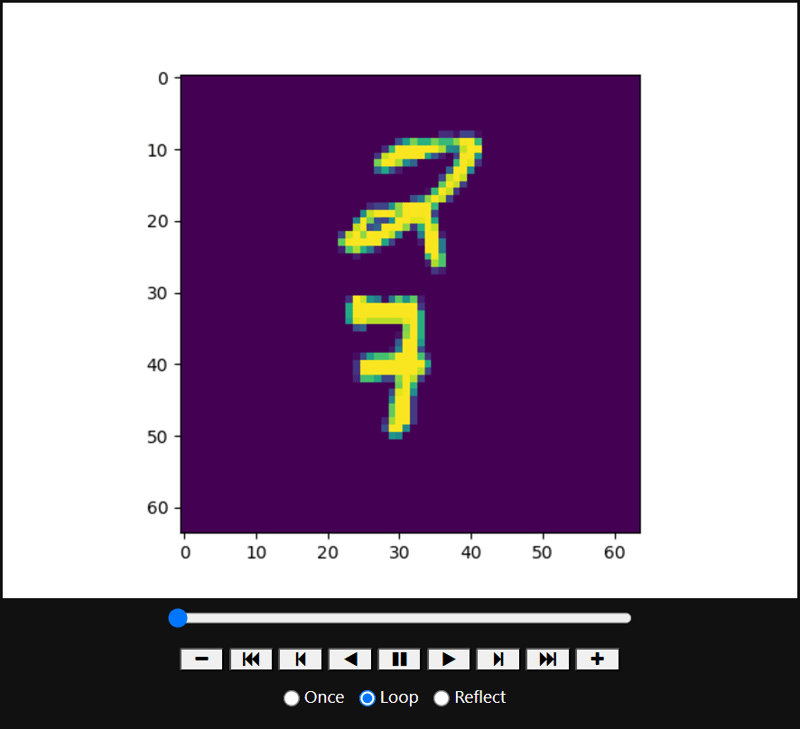
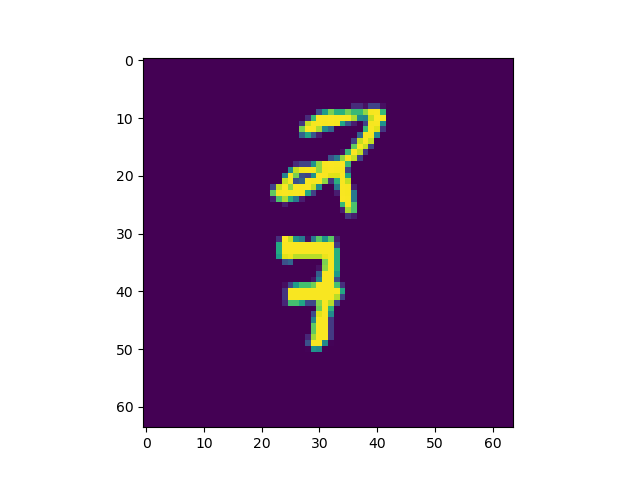
from torchvision.datasets import MovingMNIST
import matplotlib.animation as animation

all_data = MovingMNIST(
    root="data"
)

import matplotlib.pyplot as plt
from IPython.display import HTML

figure, axis = plt.subplots()

# ↓ ↓ ↓ ↓ ↓ ↓ ↓ ↓ ↓ ↓ `ArtistAnimation()` ↓ ↓ ↓ ↓ ↓ ↓ ↓ ↓ ↓ ↓
images = []
for image in all_data[0].squeeze():
    images.append([axis.imshow(image)])
ani = animation.ArtistAnimation(fig=figure, artists=images,
                                interval=100)
# ↑ ↑ ↑ ↑ ↑ ↑ ↑ ↑ ↑ ↑ `ArtistAnimation()` ↑ ↑ ↑ ↑ ↑ ↑ ↑ ↑ ↑ ↑

# ↓ ↓ ↓ ↓ ↓ ↓ ↓ ↓ ↓ `FuncAnimation()` ↓ ↓ ↓ ↓ ↓ ↓ ↓ ↓ ↓
# def animate(i):
#     axis.imshow(all_data[0].squeeze()[i])
#
# ani = animation.FuncAnimation(fig=figure, func=animate,
#                               frames=20, interval=100)
# ↑ ↑ ↑ ↑ ↑ ↑ ↑ ↑ ↑ `FuncAnimation()` ↑ ↑ ↑ ↑ ↑ ↑ ↑ ↑ ↑

# ani.save('result.gif') # Save the animation as a `.gif` file

plt.ioff() # Hide a useless image

# ↓ ↓ ↓ ↓ ↓ ↓ ↓ ↓ Show animation ↓ ↓ ↓ ↓ ↓ ↓ ↓ ↓
HTML(ani.to_jshtml()) # Animation operator
# HTML(ani.to_html5_video()) # Animation video
# ↑ ↑ ↑ ↑ ↑ ↑ ↑ ↑ Show animation ↑ ↑ ↑ ↑ ↑ ↑ ↑ ↑

# ↓ ↓ ↓ ↓ ↓ ↓ ↓ ↓ ↓ ↓ ↓ ↓ Show animation ↓ ↓ ↓ ↓ ↓ ↓ ↓ ↓ ↓ ↓ ↓ ↓
# plt.rcParams["animation.html"] = "jshtml" # Animation operator
# plt.rcParams["animation.html"] = "html5" # Animation video
# ↑ ↑ ↑ ↑ ↑ ↑ ↑ ↑ ↑ ↑ ↑ ↑ Show animation ↑ ↑ ↑ ↑ ↑ ↑ ↑ ↑ ↑ ↑ ↑ ↑
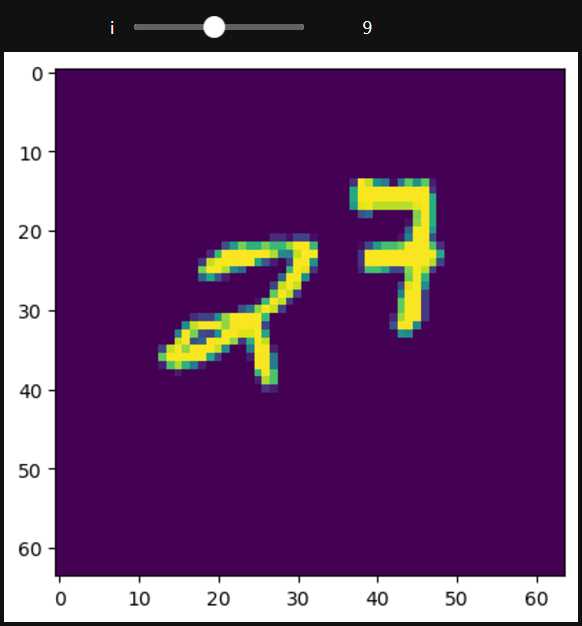
from torchvision.datasets import MovingMNIST
from ipywidgets import interact, IntSlider

all_data = MovingMNIST(
    root="data"
)

import matplotlib.pyplot as plt
from IPython.display import HTML

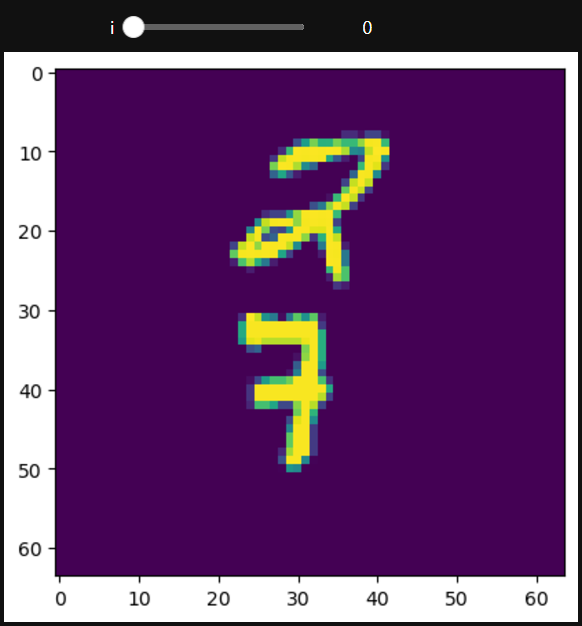
def func(i):
    plt.imshow(all_data[0].squeeze()[i])

interact(func, i=(0, 19, 1))
# interact(func, i=IntSlider(min=0, max=19, step=1, value=0))
# ↑ ↑ ↑ ↑ ↑ ↑ ↑ ↑ ↑ ↑ Set the start value ↑ ↑ ↑ ↑ ↑ ↑ ↑ ↑ ↑ ↑
plt.show()
Das obige ist der detaillierte Inhalt vonMovingMNIST in PyTorch. Für weitere Informationen folgen Sie bitte anderen verwandten Artikeln auf der PHP chinesischen Website!
Stellungnahme:
Der Inhalt dieses Artikels wird freiwillig von Internetnutzern beigesteuert und das Urheberrecht liegt beim ursprünglichen Autor. Diese Website übernimmt keine entsprechende rechtliche Verantwortung. Wenn Sie Inhalte finden, bei denen der Verdacht eines Plagiats oder einer Rechtsverletzung besteht, wenden Sie sich bitte an admin@php.cn

