
Heim >Backend-Entwicklung >Python-Tutorial >Probieren Sie die Datenanalyse in natürlicher Sprache mit Streamlit in Snowflake (SiS) aus.
Probieren Sie die Datenanalyse in natürlicher Sprache mit Streamlit in Snowflake (SiS) aus.

- DDDOriginal
- 2024-09-14 12:15:30670Durchsuche
Einführung
Snowflake hat eine LLM-Assistentenfunktion namens Snowflake Copilot als Vorschaufunktion veröffentlicht. Mit Snowflake Copilot können Sie Tabellendaten in natürlicher Sprache analysieren.
Andererseits ermöglicht Ihnen Streamlit in Snowflake (SiS) die einfache Integration generativer KI und den sicheren Zugriff auf Tabellendaten. Dies brachte mich zum Nachdenken: Könnten wir ein proaktiveres Tool zur Datenanalyse in natürlicher Sprache entwickeln? Deshalb habe ich eine App entwickelt, die Daten in natürlicher Sprache analysieren und visualisieren kann.
Hinweis: Dieser Beitrag stellt meine persönlichen Ansichten dar und nicht die von Snowflake.
Funktionsübersicht
Ziele
- Nutzbar für Geschäftsanwender, die mit SQL nicht vertraut sind
- Möglichkeit, DB/Schema/Tabelle per Mausbedienung zur Analyse auszuwählen
- Kann mit sehr mehrdeutigen Abfragen in natürlicher Sprache analysieren
Aktuelle Screenshots (Auszüge)
Im Folgenden finden Sie Auszüge aus Analyseergebnissen mit Cortex LLM (Schneeflocken-Arktis).
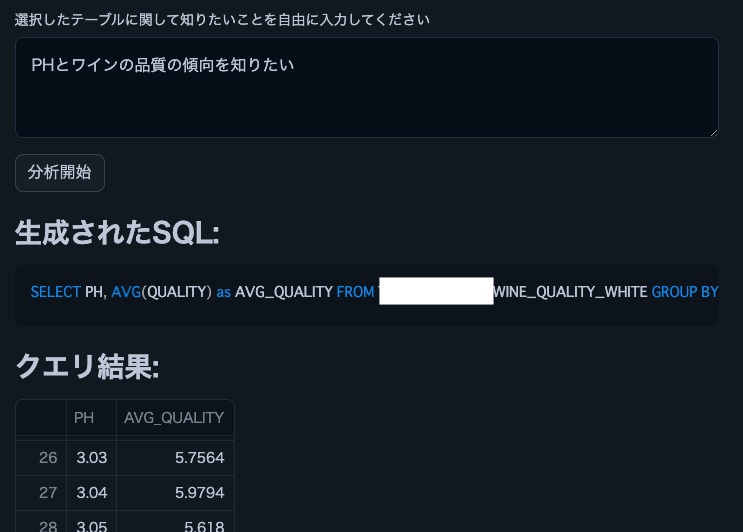
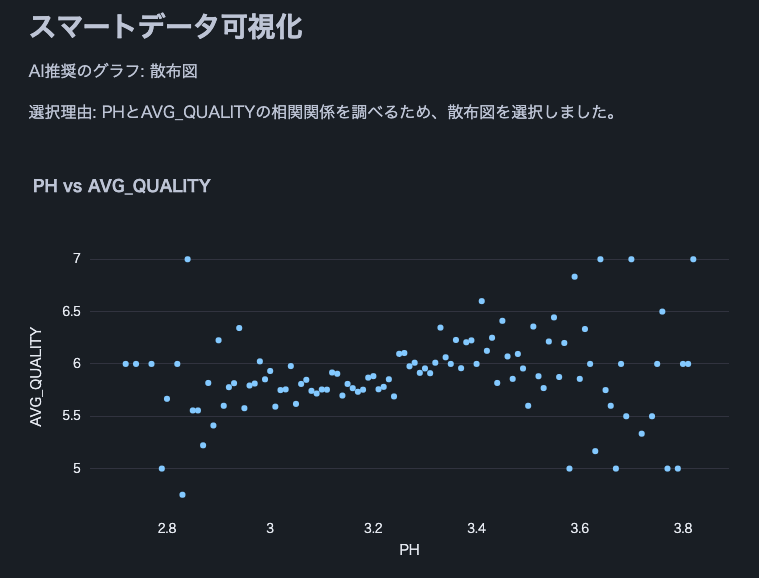

Hinweis: Wir haben diesen Weinqualitätsdatensatz verwendet.
Funktionsliste
- Wählen Sie Cortex LLM zur Analyse aus
- Wählen Sie DB/Schema/Tabelle zur Analyse aus
- Spalteninformationen und Beispieldaten der ausgewählten Tabelle anzeigen
- Analyse unter Verwendung natürlicher Spracheingaben von Benutzern
- Automatische SQL-Generierung zur Analyse
- Automatische Ausführung von generiertem SQL
- Anzeige der Ergebnisse der SQL-Abfrageausführung
- Dateneinblicke bereitgestellt von Cortex LLM
- Datenvisualisierung
- Geeignete Diagrammauswahl und -anzeige durch Cortex LLM
- Endgültige Dateninterpretation durch Cortex LLM
Betriebsbedingungen
- Snowflake-Konto mit Zugriff auf Cortex LLM
- snowflake-ml-python 1.1.2 oder höher
Vorsichtsmaßnahmen
- Seien Sie vorsichtig, wenn Sie große Datensätze verwenden, da kein Datenlimit festgelegt ist
- Die Verarbeitung großer Ergebnismengen aus generierten SQL-Abfragen kann einige Zeit in Anspruch nehmen
- Große Ergebnismengen können zu LLM-Token-Limit-Fehlern führen
Quellcode
from snowflake.snowpark.context import get_active_session
import streamlit as st
from snowflake.cortex import Complete as CompleteText
import snowflake.snowpark.functions as F
import pandas as pd
import numpy as np
import json
import plotly.express as px

# Get current session
session = get_active_session()

# Application title
st.title("Natural Language Data Analysis App")

# Cortex LLM settings
st.sidebar.title("Cortex LLM Settings")
lang_model = st.sidebar.radio("Select the language model you want to use",
                              ("snowflake-arctic", "reka-flash", "reka-core",
                               "mistral-large2", "mistral-large", "mixtral-8x7b", "mistral-7b",
                               "llama3.1-405b", "llama3.1-70b", "llama3.1-8b",
                               "llama3-70b", "llama3-8b", "llama2-70b-chat",
                               "jamba-instruct", "gemma-7b")
)

# Function to escape column names
def escape_column_name(name):
    return f'"{name}"'

# Function to get table information
def get_table_info(database, schema, table):
    # Get column information
    columns = session.sql(f"DESCRIBE TABLE {database}.{schema}.{table}").collect()

    # Create DataFrame
    column_df = pd.DataFrame(columns)

    # Get row count
    row_count = session.sql(f"SELECT COUNT(*) as count FROM {database}.{schema}.{table}").collect()[0]['COUNT']

    # Get sample data
    sample_data = session.sql(f"SELECT * FROM {database}.{schema}.{table} LIMIT 5").collect()
    sample_df = pd.DataFrame(sample_data)

    return column_df, row_count, sample_df

# Data analysis function
def analyze(df, query):
    st.subheader("Result Analysis")

    # Display basic statistical information
    st.subheader("Basic Statistics")
    st.write(df.describe())

    # Use AI for data analysis
    analysis_prompt = f"""
    Based on the following dataframe and original question, please perform data analysis.
    Concisely explain in English the insights, trends, and anomalies derived from the data.
    If possible, please also mention the following points:
    1. Data distribution and characteristics
    2. Presence of abnormal values or outliers
    3. Correlations between columns (if there are multiple numeric columns)
    4. Time-series trends (if there is date or time data)
    5. Category-specific features (if data can be divided by categories)

    Dataframe:
    {df.to_string()}

    Original question:
    {query}
    """

    analysis = CompleteText(lang_model, analysis_prompt)
    st.write(analysis)

# Data visualization function
def smart_data_visualization(df):
    st.subheader("Smart Data Visualization")

    if df.empty:
        st.warning("The dataframe is empty. There is no data to visualize.")
        return

    # Request AI for graph suggestion
    columns_info = "\n".join([f"{col} - type: {df[col].dtype}" for col in df.columns])
    sample_data = df.head().to_string()

    visualization_prompt = f"""
    Analyze the information of the following dataframe and suggest the most appropriate graph type and the columns to use for its x-axis and y-axis.
    Consider the characteristics of the data to ensure a meaningful visualization.

    Column information:
    {columns_info}

    Sample data:
    {sample_data}

    Please provide only the following JSON data format as your response:
    {{
        "graph_type": "One of: scatter plot, bar chart, line chart, histogram, box plot",
        "x_axis": "Column name to use for x-axis",
        "y_axis": "Column name to use for y-axis (if applicable)",
        "explanation": "Brief explanation of the selection reason"
    }}
    """

    ai_suggestion = CompleteText(lang_model, visualization_prompt)

    try:
        suggestion = json.loads(ai_suggestion)
        graph_type = suggestion['graph_type']
        x_axis = suggestion['x_axis']
        y_axis = suggestion.get('y_axis')  # y-axis might not be needed in some cases
        explanation = suggestion['explanation']

        st.write(f"AI recommended graph: {graph_type}")
        st.write(f"Selection reason: {explanation}")

        if graph_type == "scatter plot":
            fig = px.scatter(df, x=x_axis, y=y_axis, title=f"{x_axis} vs {y_axis}")
        elif graph_type == "bar chart":
            fig = px.bar(df, x=x_axis, y=y_axis, title=f"{y_axis} by {x_axis}")
        elif graph_type == "line chart":
            fig = px.line(df, x=x_axis, y=y_axis, title=f"{y_axis} over {x_axis}")
        elif graph_type == "histogram":
            fig = px.histogram(df, x=x_axis, title=f"Distribution of {x_axis}")
        elif graph_type == "box plot":
            fig = px.box(df, x=x_axis, y=y_axis, title=f"Distribution of {y_axis} by {x_axis}")
        else:
            st.warning(f"Unsupported graph type: {graph_type}")
            return

        st.plotly_chart(fig)

    except json.JSONDecodeError:
        st.error("Failed to parse AI suggestion. Please try again.")
    except KeyError as e:
        st.error(f"AI suggestion is missing necessary information: {str(e)}")
    except Exception as e:
        st.error(f"An error occurred while creating the graph: {str(e)}")

    # AI interpretation of visualization
    visualization_interpretation_prompt = f"""
    Based on the following dataset and created graph, please provide a detailed interpretation of the data trends and characteristics in English.
    Point out possible insights, patterns, anomalies, or areas that require additional analysis.

    Dataset information:
    Columns: {', '.join(df.columns)}
    Number of rows: {len(df)}

    Created graph:
    Type: {graph_type}
    X-axis: {x_axis}
    Y-axis: {y_axis if y_axis else 'None'}
    """

    ai_interpretation = CompleteText(lang_model, visualization_interpretation_prompt)
    st.subheader("AI Interpretation of the Graph")
    st.write(ai_interpretation)

# Function to handle cases where AI response is not just SQL query
def clean_sql_query(query):
    # Remove leading and trailing whitespace
    query = query.strip()
    # If not starting with SQL keywords, remove everything up to the first SELECT
    if not query.upper().startswith(('SELECT')):
        keywords = ['SELECT']
        for keyword in keywords:
            if keyword in query.upper():
                query = query[query.upper().index(keyword):]
                break
    return query

# Function for natural language querying of DB
def data_analysis_and_natural_language_query():
    # Database selection
    databases = session.sql("SHOW DATABASES").collect()
    database_names = [row['name'] for row in databases]
    selected_database = st.selectbox("Select a database", database_names)

    if selected_database:
        # Schema selection
        schemas = session.sql(f"SHOW SCHEMAS IN DATABASE {selected_database}").collect()
        schema_names = [row['name'] for row in schemas]
        selected_schema = st.selectbox("Select a schema", schema_names)

        if selected_schema:
            # Table selection
            tables = session.sql(f"SHOW TABLES IN {selected_database}.{selected_schema}").collect()
            table_names = [row['name'] for row in tables]
            selected_table = st.selectbox("Select a table", table_names)

            if selected_table:
                # Get table information
                column_df, row_count, sample_df = get_table_info(selected_database, selected_schema, selected_table)

                st.subheader("Table Information")
                st.write(f"Table name: `{selected_database}.{selected_schema}.{selected_table}`")
                st.write(f"Total rows: **{row_count:,}**")

                st.subheader("Column Information")
                st.dataframe(column_df)

                st.subheader("Sample Data (showing only 5 rows)")
                st.dataframe(sample_df)

                # Stringify table information (for AI)
                table_info = f"""
                Table name: {selected_database}.{selected_schema}.{selected_table}
                Total rows: {row_count}

                Column information:
                {column_df.to_string(index=False)}
                Sample data:
                {sample_df.to_string(index=False)}
                """

                # Natural language input from user
                user_query = st.text_area("Enter what you want to know about the selected table")

                if st.button("Start Analysis"):
                    if user_query:
                        # Use AI to generate SQL
                        prompt = f"""
                        Based on the following table information and question, please generate an appropriate SQL query.
                        Return only the generated SQL query without any additional response.

                        Table information:
                        {table_info}

                        Question: {user_query}

                        Notes:
                        - Follow Snowflake SQL syntax.
                        - Use aggregate functions to keep the query result size manageable.
                        - Use {selected_database}.{selected_schema}.{selected_table} as the table name.
                        """

                        generated_sql = CompleteText(lang_model, prompt)
                        generated_sql = clean_sql_query(generated_sql)
                        st.subheader("Generated SQL:")
                        st.code(generated_sql, language='sql')

                        try:
                            # Execute the generated SQL
                            result = session.sql(generated_sql).collect()
                            df = pd.DataFrame(result)

                            st.subheader("Query Result:")
                            st.dataframe(df)

                            # Analyze results
                            analyze(df, user_query)

                            # Smart data visualization
                            smart_data_visualization(df)

                        except Exception as e:
                            st.error(f"An error occurred while executing the query: {str(e)}")
                    else:
                        st.warning("Please enter a question.")

# Execution part
data_analysis_and_natural_language_query()
Abschluss
Die Möglichkeit, Tabellendaten ohne SQL- oder Python-Kenntnisse einfach in natürlicher Sprache zu analysieren, könnte den Umfang der Datennutzung in Unternehmen für Geschäftsanwender erheblich erweitern. Durch das Hinzufügen von Funktionen wie dem Zusammenführen mehrerer Tabellen oder der Erhöhung der Vielfalt an Visualisierungsdiagrammen können noch komplexere Analysen durchgeführt werden. Ich ermutige jeden, die Demokratisierung der Datenanalyse mithilfe von Streamlit in Snowflake zu implementieren.
Ankündigungen
Was gibt es Neues bei Snowflake? Updates auf X
Ich teile Snowflakes Neuigkeiten-Updates auf X. Bitte folgen Sie uns gerne, wenn Sie interessiert sind!
Englische Version
Snowflake What's New Bot (englische Version)
https://x.com/snow_new_en
Japanische Version
Snowflake What's New Bot (Japanische Version)
https://x.com/snow_new_jp
Änderungsverlauf
(20240914) Erster Beitrag
Originaler japanischer Artikel
https://zenn.dev/tsubasa_tech/articles/2608c820294860
Das obige ist der detaillierte Inhalt vonProbieren Sie die Datenanalyse in natürlicher Sprache mit Streamlit in Snowflake (SiS) aus.. Für weitere Informationen folgen Sie bitte anderen verwandten Artikeln auf der PHP chinesischen Website!