浅谈使用angular9+echarts绘制3D地图

- 青灯夜游 转载
- 2021-03-25 11:37:25 2232浏览
本篇文章给大家分享一下angular中echarts的用法,介绍绘制3d地图的方法。有一定的参考价值,有需要的朋友可以参考一下,希望对大家有所帮助。

新建一个angular9的工程
1、安装了@angular-cli的脚手架
2、<strong>ng -v</strong>查看版本
3、ng new my-project(项目名)
下载echarts
npm i echarts
相关推荐:《angular教程》
创建容器
src/app/app.componnet.html
<div id="main" style="max-width:90%"></div>
创建地图实例
src/app/app.componnet.ts
import { Component } from '@angular/core';
import * as echarts from "echarts";
import 'echarts/map/js/china.js'
@Component({
selector: 'app-root',
templateUrl: './app.component.html',
styleUrls: ['./app.component.scss']
})
export class AppComponent {
option = {
title: {
top: 10,
text: '3D中国地图',
left: 'center',
textStyle: {
color: '#fff'
}
},
backgroundColor: 'rgba(0, 10, 52, 1)',
geo: {
map: 'china',
aspectScale: 0.75,
layoutCenter: ["50%", "51.5%"], //地图位置
layoutSize: '118%',
roam: true,
itemStyle: {
normal: {
borderColor: 'rgba(147, 235, 248, 1)',
borderWidth: 0.5,
color: {
type: 'linear-gradient',
x: 0,
y: 1500,
x2: 2500,
y2: 0,
colorStops: [{
offset: 0,
color: '#009DA1' // 0% 处的颜色
}, {
offset: 1,
color: '#005B9E' // 50% 处的颜色
}],
global: true // 缺省为 false
},
opacity: 0.5,
},
emphasis: {
areaColor: '#2a333d'
}
},
regions: [{
name: '南海诸岛',
itemStyle: {
areaColor: 'rgba(0, 10, 52, 1)',
borderColor: 'rgba(0, 10, 52, 1)'
},
emphasis: {
areaColor: 'rgba(0, 10, 52, 1)',
borderColor: 'rgba(0, 10, 52, 1)'
}
}],
z: 2
},
series: [{
type: 'map',
map: 'china',
tooltip: {
show: false
},
label: {
show: true,
color: '#FFFFFF',
fontSize: 16
},
aspectScale: 0.75,
layoutCenter: ["50%", "50%"], //地图位置
layoutSize: '118%',
roam: true,
itemStyle: {
normal: {
borderColor: 'rgba(147, 235, 248, 0.6)',
borderWidth: 0.8,
areaColor: {
type: 'linear-gradient',
x: 0,
y: 1200,
x2: 1000,
y2: 0,
colorStops: [{
offset: 0,
color: '#009DA1' // 0% 处的颜色
}, {
offset: 1,
color: '#005B9E' // 50% 处的颜色
}],
global: true // 缺省为 false
},
},
emphasis: {
areaColor: 'rgba(147, 235, 248, 0)'
}
},
zlevel: 1
}]
};
ngOnInit(){
let dom = document.getElementById('main')
let myChart = echarts.init(dom)
myChart.on('georoam', function(params) {
var option = myChart.getOption(); //获得option对象
if (params.zoom != null && params.zoom != undefined) { //捕捉到缩放时
option.geo[0].zoom = option.series[0].zoom; //下层geo的缩放等级跟着上层的geo一起改变
option.geo[0].center = option.series[0].center; //下层的geo的中心位置随着上层geo一起改变
} else { //捕捉到拖曳时
option.geo[0].center = option.series[0].center; //下层的geo的中心位置随着上层geo一起改变
}
myChart.setOption(option); //设置option
});
myChart.setOption(this.option)
}
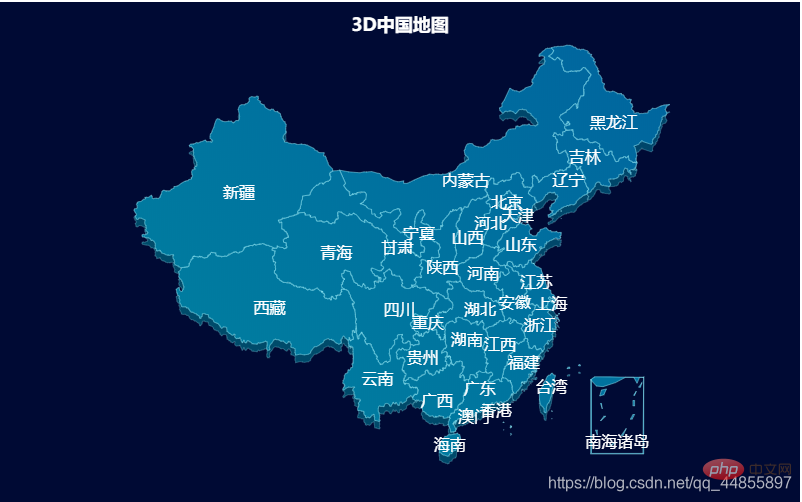
}效果图片
更多编程相关知识,请访问:编程视频!!
声明:本文转载于:csdn,如有侵犯,请联系admin@php.cn删除